TE Connectivity
The cheaper half of the AI-connector duopoly.
Every AI rack is held together by copper. The GPUs talk to each other over high-speed cable and backplane connectors, and that in-rack wiring is a two-horse market: Amphenol and TE Connectivity. Every accelerator that ships needs it, and there is no third supplier of consequence.
TE holds a strong position in the custom-silicon programs at the major cloud operators, and its data-centre business is growing fast. The other half of the company, mostly tied to cars, is not. That split is the whole story, and it raises a simple question: is the market paying for the car business and getting the AI business close to free?
That last question is the whole case. Amphenol and TE sell into the same racks, to the same buyers, yet Amphenol trades at 32 times forward earnings and TE at 18. The spread has stayed open long enough that the “second-source discount” is starting to look less like a discount than a misprint.
Buy the second-source discount, not a single quarter. The payoff is a re-rating of the multiple rather than an earnings surprise, so size the position for patience and judge it over years, not prints.
Price targets
On the base case we are close to the Street. Where we differ is the shape of the distribution around it.
The weighted $262 is almost exactly the Street’s consensus: a $262 average, a $190 to $302 range, and a Buy rating. We agree on the base. Where we part company is the spread. We think the re-rating optionality in the bull case ($357) is underpriced, and that the floor sits higher than the Street’s $190 low. The drivers behind these numbers sit in the bridge table in section seven, and they are worth reading before the targets.
Copper will continue to be the workhorse in the rack. It’s not copper or optical, it’s copper and optical. The orders that we have received are building backlog into 2027. Terrence Curtin, CEO, TE Connectivity, Q2 FY2026 earnings call, 22 April 2026
That one sentence carries both the bull case and the main risk. (The rack is the cabinet that holds a cluster of GPUs and wires them together into a single machine; copper is the short, fast link inside it.) On the bull side, copper is still the dominant in-rack link, demand is strong enough that the company is already booking 2027, and the orders are real: a record $5.3B in Q2 at a book-to-bill of 1.12. On the risk side, Curtin reaches for “copper and optical” in the same breath, and TE has just bought into leading-edge optical technology to widen its roadmap. The hedge tells you the optics question is live. So the investment case turns on how much of the company is the copper workhorse, and how much has to become the optical hedge.
By the numbers · Q2 FY2026
01 Where TE sits in the stack
AI runs on a physical supply chain. The layers below are the chokepoints atlas: L0 at the base (raw materials) up to L8 (the apps people pay for). Red layers are real chokepoints, meaning one or two suppliers, one region, or multi-year lead times. TE sells at L4, in high-speed connectors and cable. That is a genuine chokepoint, but a shared one: TE and Amphenol both supply it, so TE owns half of the bottleneck rather than all of it.
In-rack copper for scale-up systems is close to a duopoly. Amphenol and TE supply most of it, and you cannot build a dense GPU rack without it. Optics will take the longer links between racks; copper holds the short, fast links inside the rack. For an investor the distinction matters, because TE owns half of a chokepoint rather than a monopoly. Its edge is price, not a moat nobody else has. No third credible supplier has broken in at the leading edge, so the duopoly itself is the protection, and the second seat inside it is what you are buying at a discount.
02 What a connector actually is
The investment case stands or falls on the product, so it is worth understanding how a connector actually works. A connector joins two segments of wire or two circuit boards so an electrical signal can pass between them, reliably and cheaply at scale. The hard part in a modern AI server is that the signals are very-high-frequency analogue waveforms running at tens of gigabits per second, and the connector has to preserve the shape of those waveforms as they pass through. If the signal degrades, the GPU at the other end receives a corrupted bit.
Stopping that is signal-integrity engineering, and it is genuinely difficult: pin geometry, the dielectric around the pins, how the cable is terminated, how the assembly is routed inside the rack. The big AI platforms need three things in particular:
- Backplane connectors that join the main board to plug-in cards in the server chassis.
- Direct-attach copper (DAC) cables that link one GPU directly to the next, or to a switch, in a fixed-length assembly built to tight tolerance.
- High-speed cable assemblies that fan out from a switch to many GPUs, each cable tuned to the same electrical length.
The canonical example is Nvidia’s GB200 NVL72 rack, which wires together its 72 GPUs with about 5,000 copper NVLink cables. The design is copper rather than optical because an all-optical version would draw far more power. Over the distances inside a single rack, copper wins on the things that decide the design: cheaper per port, lower latency, lower power.
Once a connector is designed into a platform, it tends to stay. The hyperscaler qualification cycle is long, running through electrical simulation, mechanical and thermal testing, pilot builds, and then full production, and it can take well over a year. After that the connector ships for the life of the platform. A customer will not swap a qualified connector for a cheaper one lightly, because the connector is a tiny fraction of the cost of the rack and the cost of getting it wrong is enormous. That is the moat, and it is structural: a multi-year qualification cycle and a track record on the platforms that matter, rather than a brand or a patent.
The argument between bulls and bears is copper versus optics, and really it is an argument about where the line between them sits. Consensus today puts it at the edge of the rack. The risk is that the line moves inward over time, and that risk now has a date on it. Nvidia plans optical scale-up for systems of more than 1,000 GPUs by about 2028, and has invested billions in optical suppliers. Copper is expected to stay the in-rack workhorse through the near-term Vera Rubin generation in 2026 and 2027. TE’s answer is that it is not a pure copper bet; it has bought leading-edge optical technology to strengthen its passive optical roadmap. The hedge is real, and it costs the bull case some of its simplicity.
03 The company, briefly
TE makes connectors and sensors. Those two words cover an enormous range of products: the small terminals inside a car dashboard, the heavy blocks that route power through a factory, and the precision backplanes and DAC cables that link GPUs inside a server rack. The lineage runs back to 1941, when AMP Incorporated was founded in Pennsylvania. It was spun out of Tyco in 2007, renamed TE Connectivity in 2011, and later redomiciled to Ireland, which is where the “plc” comes from. It employs about 90,000 people across roughly 130 countries.
Today TE sells into three places: cars (the Transportation segment, mostly automotive sensors and harnesses), factories (industrial automation, energy, aerospace), and data centres (the Digital Data Networks unit inside Industrial). The split between the first two and the third is what defines the investment case.
One half is accelerating and the other is flat. The blended company grew 7% organic, and the market prices the blend rather than the half that is winning. The opportunity is in that gap.
04 How it makes money
The model is simple to describe and hard to compete with.
The flywheel is the whole model, and the hard part is the front of it. The segment numbers show the cycle in action: Industrial, which contains DDN, was up 27% reported, with DDN itself up 46% organic, while Transportation was down 0.5% organic.
In March 2026 TE raised its quarterly dividend to $0.78 from $0.71 and expanded the buyback authorisation by $3.0B, to $22.25B in total. A company asking the market to re-rate it on AI orders is, in the same quarter, handing real cash back while the multiple is still wide. Read that as confidence in the cash flows behind the order book.
05 The AI engine: Digital Data Networks
DDN is the reason to look at the stock now. The unit sits inside Industrial and houses TE’s data-centre and AI business: the high-speed connectors, cable assemblies and backplanes used inside AI server racks.
The macro picture is simple. Hyperscalers are still building AI capacity faster than the supply chain can keep up, and TE is one of only two suppliers they can call. TE raised its $2.4B AI target mid-year rather than setting it at the start, and Curtin said the orders already in hand stretch into 2027. That is more visibility than most AI-exposed suppliers can claim. Orders hit a record $5.3B in the quarter, up 25% on the year and running ahead of sales, so the demand is booked rather than hoped for.
The lever to watch is the mix. AI is only about 13% of TE’s roughly $18.7B in annual sales today. The bull case is that this share climbs into the high teens or low twenties over the next two to three years, the point at which the slow car business stops dragging down the valuation. That share is the single number to track.
06 Cheap against what?
Valuation only means something in comparison, so here are three: peers now, TE against its own history, and the cash flows the market is discounting.
| Company | Forward P/E | EV/EBITDA | Read |
|---|---|---|---|
| Amphenol | 31.9× | 25.6× | AI-interconnect premium |
| Corning | ~28× | n/a | Optical fibre, AI backbone |
| TE Connectivity | 18.1× | 14.4× | #2, priced with the autos |
| Belden | ~17× | ~13× | Industrial cabling |
| Aptiv | ~11× | ~9× | Auto-exposed |
| Sensata | ~9.5× | ~8.5× | Auto-exposed |
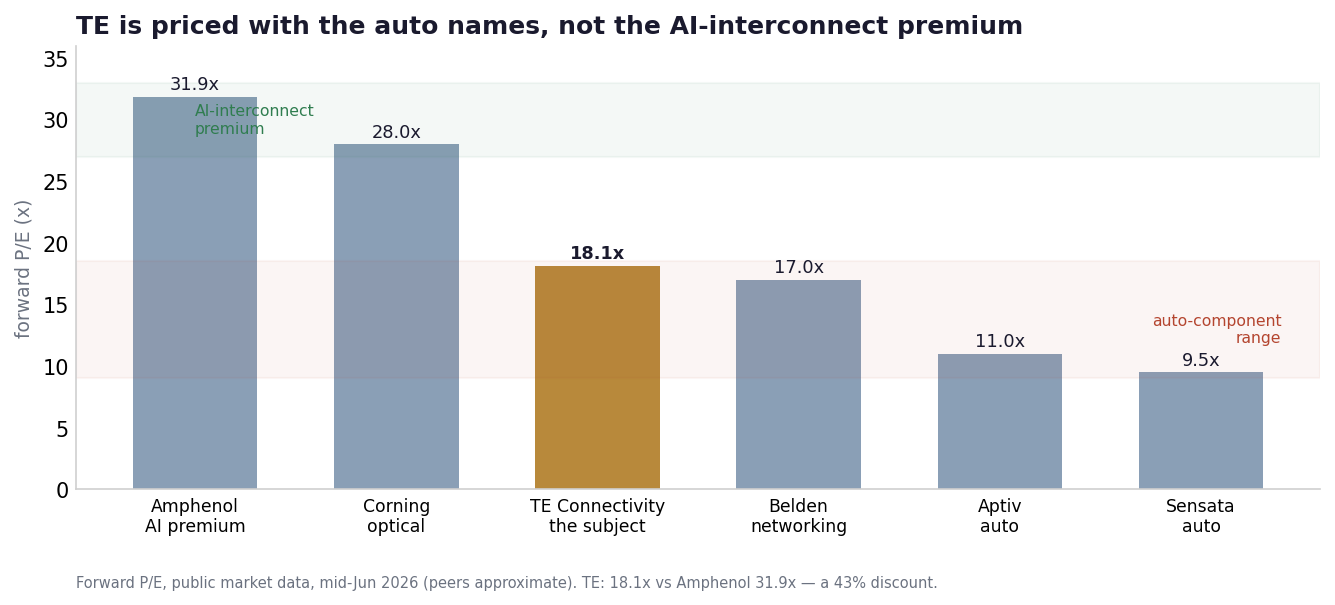
TE also looks cheap against itself. Its own trailing P/E sits at 21.9×, against a ten-year mean near 28× and a five-year range of 12.9× to 32.5×. So TE today is roughly 22% below its own long-run average. Amphenol has gone the other way: it re-rated up on AI and still trades at a premium to its own median near 30×. The gap is wide three ways at once, against Amphenol, against the AI-interconnect group, and against TE’s own past.
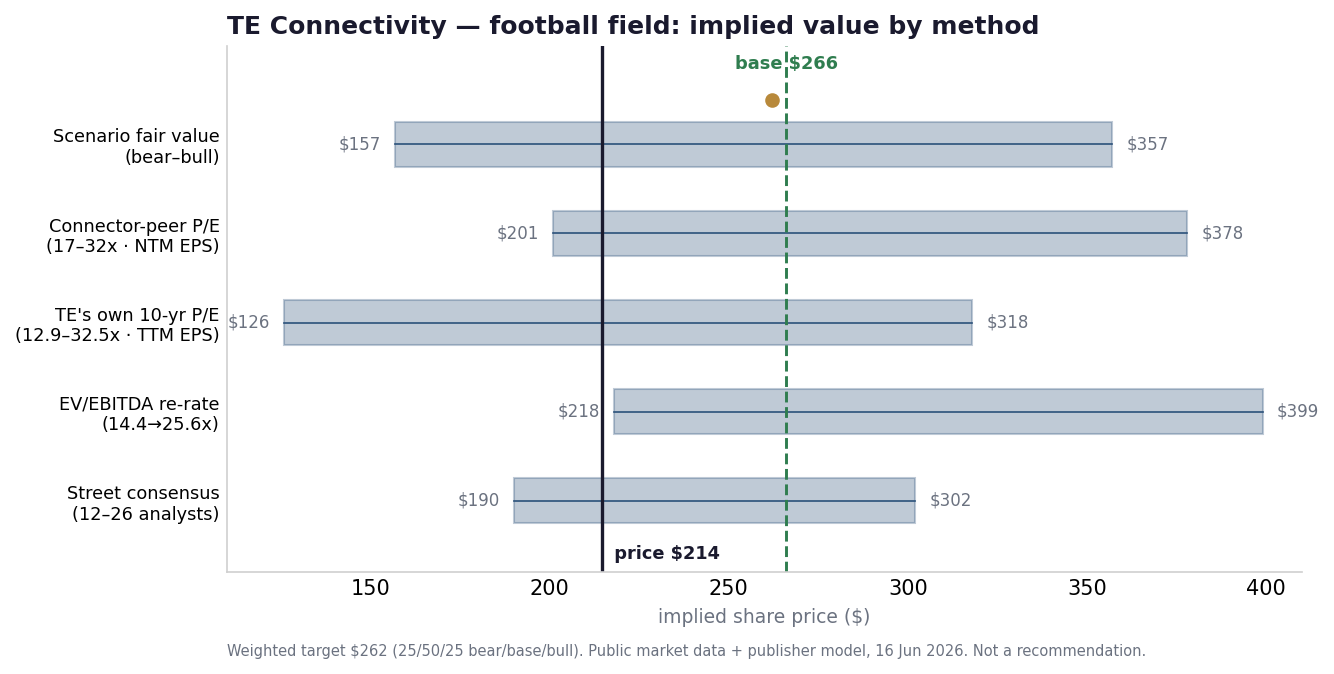
Putting the methods on one page, the implied price band by approach comes out as:
- Scenario fair value (bear / base / bull): $157, $266, $357.
- Connector-peer forward P/E (17× to 32×) on NTM EPS: $201 to $378.
- TE’s own ten-year P/E (12.9× to 32.5×) on TTM EPS: $126 to $318.
- EV/EBITDA re-rate (14.4× to 25.6×): $218 to $399.
- Street consensus range: $190 to $302, average $262.
The cash flows tell the same story. At $214.50, a reverse-DCF says the market is discounting only about 4.4% free-cash-flow growth a year for ten years, on a 9% cost of capital and a 2.5% terminal rate. A company with that order book and 46% organic growth in its AI line is not a 4.4% grower, unless the car business drags everything down forever. Re-rate EV/EBITDA to 20×, still below the twin’s 25.6×, and the implied value is about $308, or +44%; at Amphenol parity it is about $399, or +86%. The bet is not on a boom. It is that the discount is too wide.
07 How the three cases add up
The honest way to bridge “should be worth more” and “$266” is to show the maths. The lever is not capacity. It is the exit multiple. AI revenue and the auto trajectory set the EPS, and the re-rating does the rest.
| Case | AI/DDN FY27 | non-AI | FY27 adj EPS | Exit P/E | Fair value | vs $214.50 |
|---|---|---|---|---|---|---|
| Bear | ~$2.8B | −2% | $12.2 | 14× | $157 | −27% |
| Base | ~$3.4B | +2% | $13.2 | 22× | $266 | +24% |
| Bull | ~$4.0B | +4% | $13.9 | 28× | $357 | +66% |
AI decelerates to about $2.8B, autos fall into recession (−2%), and the multiple de-rates to the 2023 trough of 14×. Group revenue near $19.7B.
AI grows on trend (about $3.4B), autos stay flat (+2%), and the stock re-rates to 22×, still below its 28× ten-year mean. Group revenue near $20.9B.
AI beats (about $4.0B), autos recover (+4%), and the stock re-rates to its 28× mean. Group revenue near $21.9B.
Each fair value is the exit multiple applied to FY27 adjusted EPS, then discounted back about a year at a 9% cost of capital. That is why the base reads $266 rather than the naive $290 you get from 22× times $13.2. The discount keeps the base case honest. Read the table one way and the point jumps out: the swing factor is the exit multiple, not the EPS. Across all three cases the EPS barely moves, from $12.2 to $13.9, while the multiple swings from 14× to 28×. The value is made in the re-rating, which is also why the trade is easy to underprice.
08 Pumps and corrections
This is a re-rating stock, so it trades on the multiple and on expectations as much as on the fundamentals. That makes the tape do counter-intuitive things. The cleanest example is that TE has, more than once, fallen on a quarter that was a clear beat with record orders. The reason was not the print. It was the bar. The market had already priced a strong quarter, so meeting it rather than clearing it was enough to trigger a sell-off.
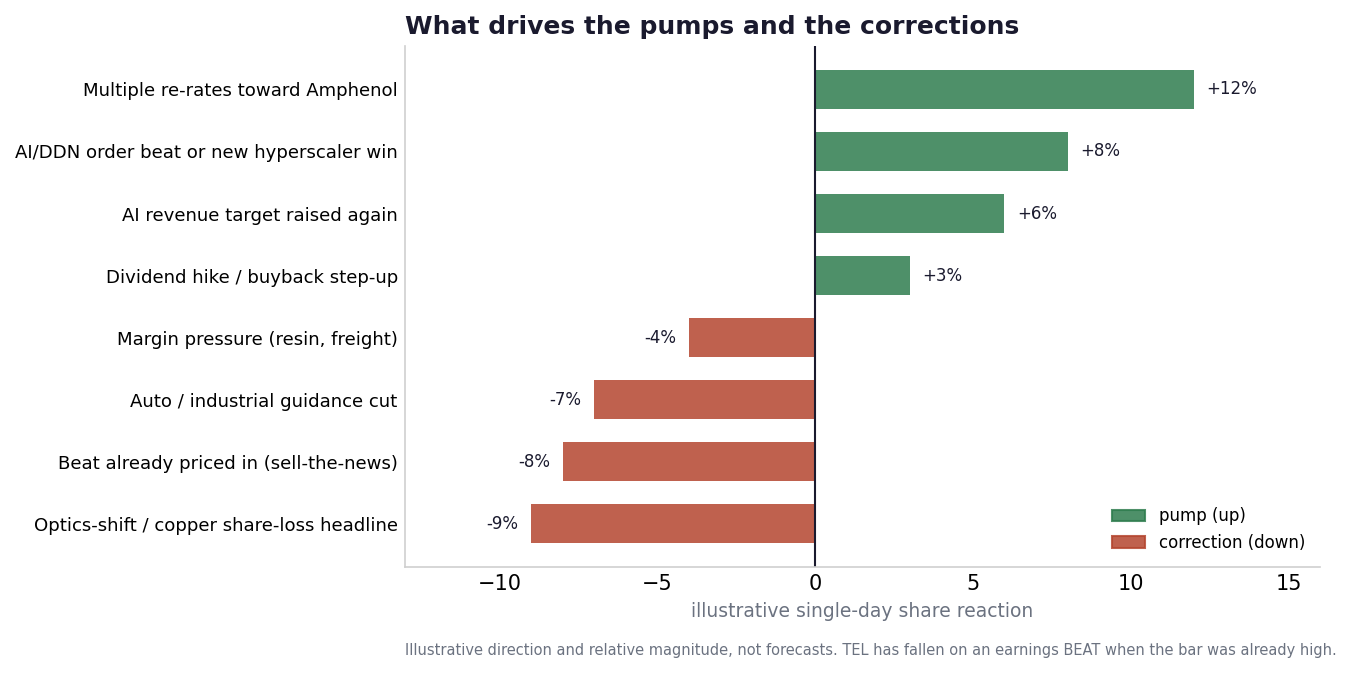
▲ Pumps
- A multiple re-rate toward Amphenol. Even a two-turn step in the forward P/E implies a low-double-digit move.
- A DDN order beat or a new hyperscaler program win, or anything that says the AI mix is rising faster than the Street has in.
- Another in-year raise of the AI revenue target, on top of the $150M step in Q2.
- A dividend or buyback step-up, which the market reads as management conviction.
- A clean update on the optics acquisition that lands the “copper and optical” story with investors.
▼ Corrections
- A beat that was already in the price, as above.
- An auto or industrial guidance cut, even a small one, since the auto drag is the whole reason the multiple is compressed.
- An optics-shift or copper-share-loss headline. The 2028 horizon is the kind of date the market will pull forward on a rumour.
- Margin pressure from input costs such as resin and freight, modest each time and corrosive over a run of quarters.
- Multiple compression in a broader AI sell-off, when the whole cohort goes down together.
The practical lesson on entry is to size and time around the expectations bar, not the print. A good quarter after a strong run can still correct, while a good-enough quarter on soft consensus is often where the multiple re-rates. The fundamentals here are solid. The work is in the timing.
09 Re-rating needed to make the upside real
Here is the tension we will not paper over. At a conservative 22× exit, the base-case upside (+24%) roughly matches the bear-case downside (−27%), so on the multiple alone the trade is close to a coin flip. It turns clearly asymmetric only once the exit multiple clears about 24×, which is still below both TE’s own history and Amphenol’s multiple. The call therefore rests on the re-rating, and the reverse-DCF is what tips the odds in its favour: at today’s price the market already assumes almost no growth.
The other thing we will not pretend away is that the gap to Amphenol is not random. Amphenol leads on speed, holds the larger Nvidia position, and earns its higher multiple for those reasons. The 43% discount is a real second-source discount, not a misprint. Our case is that the gap is too wide for what is, at the platform level, a very similar product. The bear case is that the gap is simply fair.
10 The two-sided case
- 43% cheaper than Amphenol on forward earnings, 44% on EV/EBITDA, for the same end-market.
- ~$2.4B FY26 AI revenue target, raised mid-year, with DDN orders up about 60% YoY.
- Record orders of $5.3B at a book-to-bill of 1.12. Demand is booked.
- Reverse-DCF implies only 4.4% long-run growth priced in, so the bar is low.
- Record $2.73 adjusted EPS and margin up to 22%. The model works at scale.
- Dividend raised to $0.78 a quarter and a $22.25B buyback authorisation behind the thesis.
- TE is the number two. Amphenol is widely seen as the leader on speed, with a larger Nvidia position.
- Roughly half of revenue sits in slow-growth transportation and industrial markets that fall in a downturn.
- Copper-to-optics share loss inside the rack is a real long-run risk to the whole thesis.
- Nvidia moves toward optical scale-up by about 2028, so copper’s in-rack dominance has a visible clock on it.
- The upside is a re-rating. If the discount turns out to be structural, you wait and earn little.
- Margins face input-cost pressure from resins and logistics.
11 Scorecard
12 What moves the signal
▲ Moves to higher conviction if
- AI and DDN revenue clears the ~$2.4B target and the mix passes about 15% of the company.
- The forward multiple re-rates through 22×.
- The auto drag is separated out, wound down, or simply fades as a share of revenue.
▼ Moves to sell or reduce if
- Copper loses scale-up share to optics inside the rack faster than expected.
- An auto and industrial downturn pulls group earnings down while the multiple stays at trough.
- The discount to Amphenol persists with no catalyst, which would confirm it is structural.
The one number we track from here is AI revenue as a share of the group. It is in the low teens today. When it clears roughly 15%, the auto drag stops setting the price, and the re-rating case stops being a forecast and starts being a fact.
Not investment advice. For information and discussion only, and not a personal recommendation, offer or solicitation. Capital is at risk, and investments can fall as well as rise. The price targets here are the publisher’s scenario-based fair-value estimates, not a forecast or a guarantee. Do your own work.
All figures come from TE Connectivity’s public disclosures, peer public market data, and the publisher’s own calculations. Broker research informed our internal conviction but is not quoted here. Sources: TE Q2 FY2026 results (PR Newswire); earnings-call transcript (Motley Fool); Stock Analysis and Companies Market Cap; The Register on Nvidia optical scale-up. © 2026 chokepoints.ai · Issue 003 · TE sits at L4 (compute hardware, high-speed interconnect) in the chokepoints AI-compute map. All issues