SUSS MicroTec
The number two in the step every HBM layer repeats.
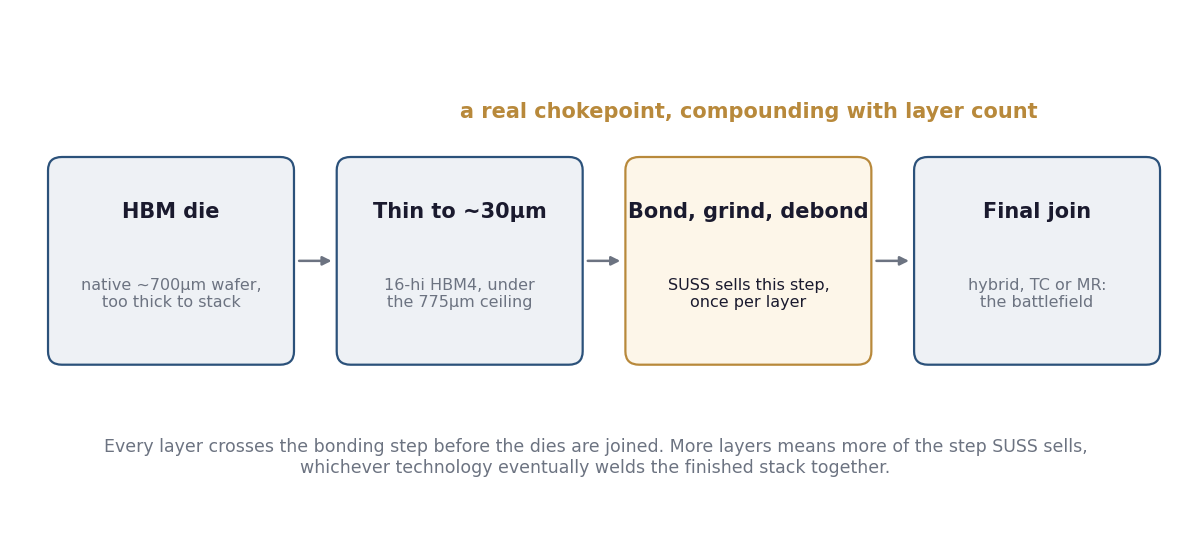
A finished HBM stack is not allowed to be thicker than the wafer its chips were cut from. That is a JEDEC rule, and it forces every memory die in the stack to be thinned to a fraction of its original height before it can be stacked at all. Past a certain thinness a wafer can no longer be handled unless it is glued to a carrier and released again afterwards, a cycle called temporary bond and debond. SUSS MicroTec builds the machines for both halves of it, and is one of only two toolmakers qualified to sell them into HBM today.
The cycle runs once for every layer, and layer count is climbing from twelve toward twenty. Tokyo Electron sells the same step, and sells more of it. That leaves one question: is the second seat at a step nobody can skip worth owning at €79.80, after the shares have tripled off last September’s low?
The strongest case against us says SUSS is worth its margin trough, and that the market has already paid for the physics. Tokyo Electron leads HBM temporary bonding on two 2024-vintage broker reads, it owns the SK Hynix line growing fastest, and it has just put a five-year, ¥500bn number on the category; EV Group’s laser tools become a live threat once stacks reach 16-hi. Neither risk resolves in public sourcing, and the shares have doubled this year, so nobody is being handed a discount. We grant all of it. Our answer is narrow: the step is forced by arithmetic that no joining technology relieves, and a starter is how we hold that without pretending the entry is cheap.
- The chokepoint: temporary bond sits upstream of the join, so the joining fight cannot route around it, and each added layer runs it again.
- The 12-month direction: skewed up on the weighted value, with a fat bear tail if the share caps.
- The entry at today’s price: a little below the weighted value; we size a starter, not a full position.
The reverse-DCF prices the trade at a mid-case exit multiple. The 12-month fair values against a €79.80 close:
| Scenario | Fair value | vs spot (€80) | Weight |
|---|---|---|---|
| Bear: the trough proves structural | €40 | −50% | 30% |
| Base: SUSS holds its #2 seat | €100 | +25% | 45% |
| Bull: the chokepoint holds | €150 | +88% | 25% |
| Probability-weighted | €95 | +19% | 100% |
The weighted value sits about 19 percent above spot, and a bear leg toward €40 keeps this a starter rather than a full position.
01 What a temporary bonder actually is
A temporary bonder glues a silicon wafer face down onto a rigid carrier so the back of it can be ground away without the wafer shattering. A debonder takes the carrier off again afterwards. SUSS sells both halves of that pair, and together they are most of the company.
The step exists because of a thickness budget. A 300mm silicon wafer leaves the fab about 775 microns thick, roughly eight sheets of paper. JEDEC, the body that writes memory standards, caps the total height of a finished HBM4 stack at the same 775 microns. Sixteen memory chips, a logic chip beneath them and all the interconnect between have to fit inside the thickness of one raw wafer. Each chip therefore comes down to somewhere between 30 and 40 microns. At that point silicon stops behaving like a slab. It flexes, and it cracks under its own handling, so it cannot cross the rest of the line unsupported.
The fix is to give it something to lean on. The wafer gets a release layer and an adhesive, is bonded face down onto a carrier of glass or silicon at low force, then cured. Now it can be ground, etched and metallised as a rigid object, even though the device layer underneath is thinner than a human hair. SUSS sells that machine as the XBS300.
Getting the carrier back off is the harder problem, and it is a different machine, the XBC300 Gen2. It has to release a wafer of 50 microns or less, at room temperature, across 300 millimetres, without cracking something that by then carries the full value of a finished HBM layer. Where a mechanical peel would be too violent, SUSS sells the ELD300, which fires a 308 nanometre excimer laser through the glass carrier to break the adhesive optically and lift the wafer away untouched.
Two consequences follow. A JEDEC standard fixes the thickness budget, so no fab can choose to skip the step. And it repeats: every layer that needs thinning is bonded and debonded once, so a 16-high stack runs the cycle more times than a 12-high one.
02 SUSS MicroTec, briefly
Karl Süss started the company in 1949 in Garching, outside Munich, selling other people’s optical instruments: Leitz microscopes, cameras, laboratory equipment. It became a manufacturer on commission. In 1963 Siemens asked it to build a simple photolithography tool, and that contract pulled it out of distribution and into engineering. Karl Süss and his son Ekkehard both died in 1994. The business was reorganised, renamed and listed in Frankfurt in 1999.
It reports in two segments today. Advanced Backend Solutions holds imaging, coating and bonding systems, and carries most of the revenue. Photomask Solutions is the smaller half, cleaning and processing the masks that carry circuit patterns into a lithography scanner. Revenue was €446.1 million in 2024 and €503.2 million in 2025. Burkhardt Frick has been chief executive since 11 September 2023.
SUSS employed 1,498 people at the end of 2024, and 1,497 at the end of 2025, while revenue rose almost 13 percent. Fewer than fifteen hundred people in a Munich suburb, and every HBM stack shipped this year went through the step their machines perform. Section 05 settles how much of it went through their machines and how much through a competitor’s.
03 Where the step sits in the line
All of that happens before the dies are joined to one another. The joining step is a different machine, sold by different companies, and it has the industry’s attention.
The consensus read on advanced packaging is that hybrid bonding is coming: it welds dies together with direct copper contact and no solder, and it makes the tools built for the old way of joining chips obsolete. That read is right about the joining step. Hanmi, ASMPT, Besi and EV Group are fighting over it, hybrid bonding against thermocompression against mass reflow, and whoever loses that fight has a real problem.
SUSS is not in that fight. Thinning happens one station earlier, and the height budget forces it. The eventual method of attaching the dies does not enter into it. Hybrid bonding joins dies that have already been thinned. It does not thin them. Whichever way the joining fight ends, the winner’s tool sits downstream of a wafer that was bonded to a carrier, ground, and debonded first.
Arithmetic protects the step. Stack height forces the thinning, no joining technology relieves it, and a second source still has to win its qualification at each memory maker, one customer at a time.
The tape has been arguing the wrong question. The step survives either way. SUSS’s share of it is the live question.
04 Why layer count is the demand driver
The height budget also sets the growth rate. JEDEC has relaxed the ceiling twice, and the room per layer shrank both times.
Through HBM3E the ceiling was 720 microns. JEDEC raised it to 775 for HBM4 at the memory makers’ request, and that relaxation lets a 16-high stack ship on existing bonding instead of forcing hybrid bonding. The industry is now weighing 825 to 900 microns for 20-high parts. Divide each ceiling by the dies it has to hold, plus the base logic die, and the budget per layer falls from about 55 microns at 12-high, to 46 at 16-high, to 43 at a 900-micron 20-high. Interconnect comes out of the same allowance. Layer count rises faster than the ceiling does, so relaxing the standard does not relieve the thinning. It tightens it.
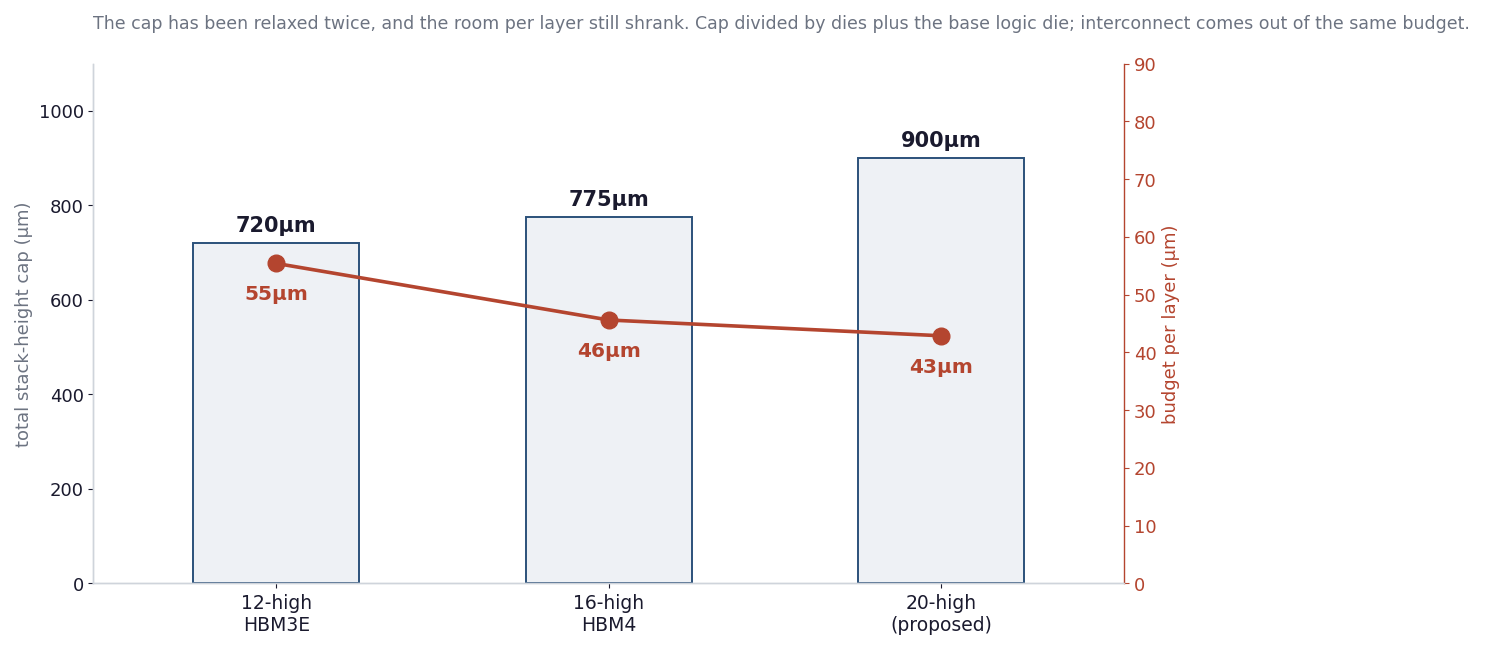
Every layer added on the way from 12-high to 20-high is another die that has to be thinned, and another bond-and-debond pass. Stacks per accelerator are fixed by interposer area, so a taller stack raises core-die count per accelerator close to one for one, and demand for the step tracks that die count.
That linearity is the easy half of the argument. The hard half is SUSS’s share of it, and two things bite into that share: Tokyo Electron’s SK Hynix lock and EV Group’s laser-debond lead.
05 Who buys the step, and where SUSS ranks
The memory makers stacking on this node split SK Hynix 60 percent, Samsung 30 percent, Micron 10 percent (Mirae Asset Securities, 15 Jun 2026): that is who buys the output, not who sells the tools. On the tool side, Jefferies scopes SUSS’s position to its two core customers at roughly 55 percent of Samsung and Micron’s combined temporary-bond spend, real share counted against a narrower base than the whole HBM pie.
SUSS is strong at two of the three makers and holds only an R&D toehold at the largest, SK Hynix, where Tokyo Electron is entrenched. The single biggest pool of demand is the one where SUSS’s seat is thinnest, so the SK Hynix qualification, and the process SK Hynix ships at 16-hi, carry more weight than the headline share suggests.
Broker estimates of SUSS’s share of the toll span a wide range. On HBM temporary bonding, Tokyo Electron is the consensus’s clear leader: Bernstein estimates 60 to 70 percent (6 Dec 2024), Jefferies a narrower c.50 percent (20 Sep 2024). SUSS is the clear number two, with broker estimates spanning 10 to 20 percent (Deutsche Bank, 11 Jul 2024) to 40 to 50 percent (Metzler Capital Markets, 28 Oct 2024); Berenberg (29 May 2024) puts it near 35 percent while naming SUSS the leader in the specialised temporary-bonding segment, a narrower cut than the whole pie.
EV Group sits in a different market. Its widely-cited 65 to 70 percent share figure describes wafer-to-wafer permanent bonding, where Bernstein (19 Nov 2025) puts EVG’s footprint in high-volume HBM lines below both TEL’s and SUSS’s. In the market that figure does measure, the split runs EVG 60 to 70 percent, TEL a little over 20 percent, SUSS 10 percent (Bernstein, 13 Mar 2025), the same challenger share the house map carries for SUSS in hybrid bonding.
| Axis | SUSS | EV Group | Tokyo Electron |
|---|---|---|---|
| HBM TBDB share | ~10 to 50% range; clear #2 | Not a current contender | Clear #1: 50 to 70% |
| Debond method | Mechanical and laser today | IR laser-only; the wildcard | Mechanical/thermal incumbent |
| Thinning spec | XBS300/XBC300, sub-50µm | Laser-release, unproven at volume | Scale, less public detail |
| Adjacent W2W share | ~10%; qualifying at TSMC, imec | 60 to 70%; W2W incumbent | ~20%+ |
| Qualification moat | Dual-sourcing opens a door | Same moat, different tech | Same shared moat |
The axes a process engineer screens a vendor on. TEL leads HBM temporary bonding outright; SUSS is a corroborated number two; EVG is a real incumbent in the adjacent permanent-bonding market, not this one, yet. Ranges above are broker estimates, not point figures.
06 Two cuts and a record year
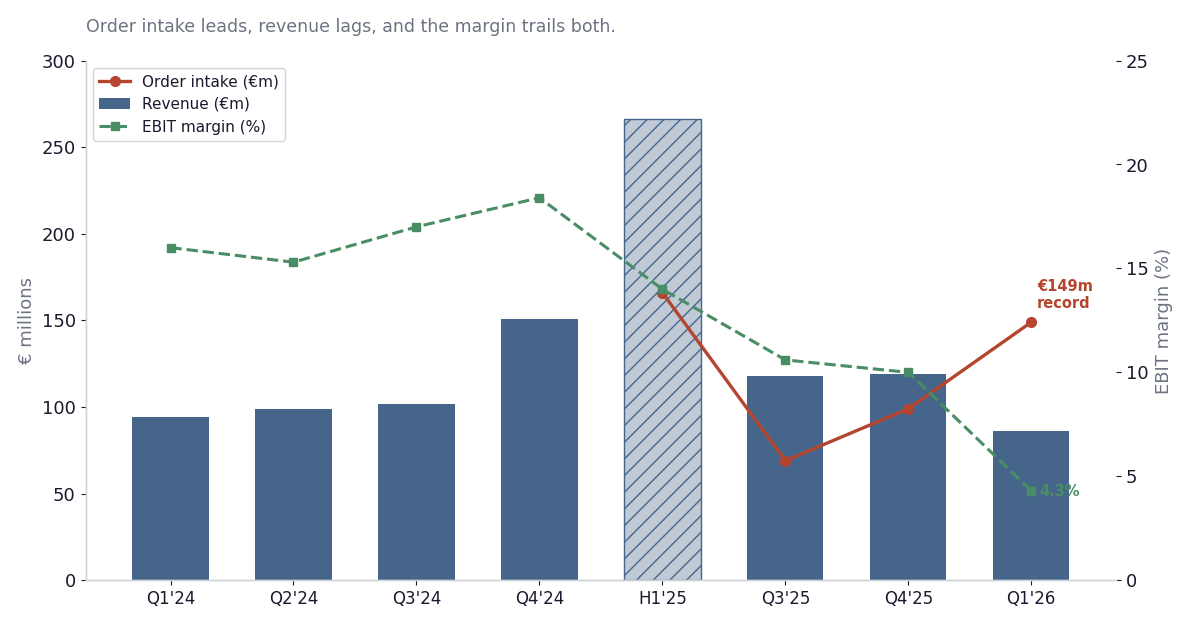
Burkhardt Frick has run SUSS since 11 September 2023, and his 2025 delivered two margin cuts and a record year inside the same twelve months. Order intake fell 16.4 percent year over year to €354.3 million even as revenue grew on backlog conversion; in equipment, the order book leads and revenue lags. Frick cut margin guidance twice: first on 28 July 2025, gross margin to 37 to 39 percent and EBIT margin to 13 to 15 percent, then on 27 October 2025 on Q3 preliminary figures that missed hard, 33.1 percent gross margin against a 38.1 percent consensus. Sales guidance was never touched either time, and FY2025 sales of €503.2 million beat the original range.
On the 30 March 2026 call Frick named the cause himself: many customers, he said, are “placing orders later and ordering different solutions compared to the peak of the first AI waves, when demand for temporary bonders and debonders was particularly high.” He was blunter about the credibility cost: “as we saw last year, where we had to go in and correct twice our guidance. This is something we don’t want to repeat.”
07 The order book and the margin disagree
Q1 2026, reported 7 May, delivered the reversal in the order book: intake of €149.3 million, a record, up 69.5 percent year over year; order book €330.1 million, up 23.7 percent in the quarter. The EBIT margin, though, was 4.3 percent, against 18.0 percent in the same quarter a year earlier, still below the low end of FY2026’s 8 to 10 percent guided range. The margin trails both intake and revenue because the cost base is fixed and the converting backlog has not yet covered it.
Asked on the same call about SK Hynix qualification, Frick said the orders meant SUSS is now “in all 3 major memory makers,” and, pressed on whether that meant repeat business, drew the line himself: “we are not talking volume orders here, but at least we have our hardware placed now in the most recent HBM R&D line.” That puts SUSS inside the door at the one memory maker the market had already priced as closed, with hardware in an R&D line and no volume behind it.
COO Thomas Rohe put a number on part of the cause: the new Zhubei, Taiwan site was running at roughly 70 percent utilisation as of the March call, still absorbing double rent against the old Hsinchu-area sites it replaces, though Q1 2026 is flagged as the last quarter carrying that specific drag. The path back to the guided floor is backlog conversion and the Zhubei ramp, not a new pricing cycle.
None of this is a China manufacturing story. SUSS’s entire production footprint sits in Germany and Zhubei, Taiwan; its China presence is a sales and service subsidiary only. The China exposure that does show up is demand-side: photomask order intake fell €43.5 million in FY2025, €31 million of it attributed to lower orders from Chinese customers, a cyclicality risk rather than a supply-chain one, and one Frick flagged as partially reversing late in Q4 2025. The balance sheet carries no draw against the €115 million syndicated facility signed in February 2026, which management frames as a cyclicality buffer.
08 The delay the market sold and we bought
We disagree with the market about one specific day, and that disagreement is the position. On 7 July 2026 TrendForce reported that Samsung and SK Hynix were reconsidering the hybrid-bonding timeline, with 16-hi HBM4E the earliest realistic adoption. SUSS closed down 12.3 percent that day, €87.45 to €76.65, its worst session of the year and the largest single move inside the fall from June’s high. The tape read that headline as bad news for SUSS. We read it as good news, and both cannot be right.
Our reading is that pushing hybrid bonding out to HBM4E extends the life of the thermocompression and mass-reflow flows, and each of those runs temporary bond and debond on every layer. The bear reading is that a hybrid-bonding delay signals the whole 16-hi node slipping, which defers every tool in the line, temporary bonders with it. Both fit the headline. They differ on whether what slipped is the joining technology or the layer count itself.
That distinction is the cleanest test of the thesis, and it resolves on a date. If 16-hi HBM4 volume arrives roughly on schedule and only the joining method moves out, the delay lengthens SUSS’s runway and the 12 percent sell-off was an overreaction. If the 16-hi ramp itself slipped, the layer-count compounding behind our base case slips with it and the market priced it correctly on the day. The H2 2026 process disclosures settle which, and so we hold a starter instead of a full position while a 12 percent tape print disagrees with us.
09 What would break this
The kill chain has two links. Either one trims SUSS’s share on its own; both together cap it, and that conjunction carries the 30 percent bear weight. The first link is process: SK Hynix’s mass-reflow flow needs fewer temporary bond and debond cycles per finished stack than the thermocompression flow Samsung and Micron run. No public source quantifies that difference, and we flag the gap instead of filling it with an assumption. The second link is competitive: EV Group’s laser-debond platform wins at 16-hi HBM4 volumes, a scenario Kepler Cheuvreux (21 May 2025) calls a future wildcard that could take share from TEL and SUSS if its laser proves superior. Both links holding sends the layer-count growth in our base case to someone else’s income statement, and makes the 2025 to 2026 margin trough correct pricing.
Three variables will tell us which way it breaks, in order of how soon we will know:
- SUSS’s own book-to-bill through H2 2026. The next hard read is the H1 2026 report, expected early-to-mid August. The tell is order intake converting into revenue; backlog alone proves nothing.
- Which final-joining process each memory maker ships at 16-hi. JEDEC’s thickness relief has already pushed hybrid bonding’s realistic debut to at least HBM4E, per TrendForce (7 Jul 2026), a delay that buys the temp-bond thesis time either way.
- Whether EV Group’s laser tools win a qualified design slot at Samsung, Micron or SK Hynix, beyond demo showcases. At that point the wildcard is a real threat.
The SK Hynix qualification headline therefore matters less than the process choice sitting behind it.
10 What €79.80 already demands
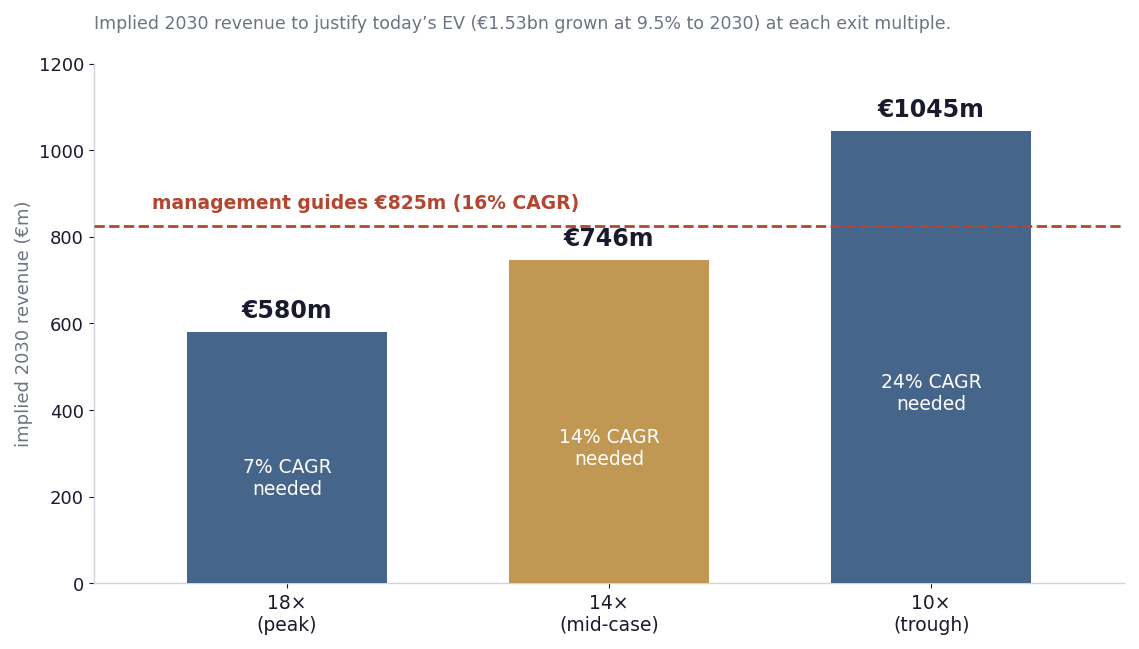
SUSS’s enterprise value sits close to its market cap: €1.526 billion on 19.12 million shares, no material net debt (yfinance, 23 Jul 2026). Grow that EV forward at a 9.5 percent WACC, a reasonable small-cap German-listed semicap discount rate, over four years to 2030, and it compounds to roughly €2.19 billion. Then ask what 2030 revenue, at management’s guided 20 to 22 percent EBIT margin, would justify that compounded EV at a given exit multiple. The base year matters as much as the multiple: SUSS guides FY2026 sales of €425 to €485 million, down from the €503.2 million FY2025 record, and every growth rate below runs off that midpoint of about €455 million.
| Exit multiple | Implied 2030 revenue | CAGR needed |
|---|---|---|
| 18× (peak) | €580m | 6% |
| 14× (mid-case) | €746m | 13% |
| 10× (trough) | €1,045m | 23% |
| Management 2030 range | €750m to €900m | 13% to 19% |
Management’s Capital Markets Day on 17 November 2025 guided €750 to €900 million of 2030 sales at a 9 to 13 percent CAGR off its 2025 base. The mid-case exit lands just under the bottom of it, so €79.80 pays for the floor of that range and nothing above it, and because 2026 is a guided down year, reaching even the floor takes a 13 percent CAGR off the FY2026 midpoint, the top of management’s own band. On this arithmetic the valuation is support and not an edge, which puts the whole upside on the share SUSS captures. We read the comps the same way:
| Company | Fwd P/E | EV/Rev | P/E (ttm) |
|---|---|---|---|
| SUSS MicroTec | 21.1× | 3.10× | 40.7× |
| BE Semiconductor | 35.8× | 29.5× | 118.1× |
| ASMPT | 30.9× | 5.0× | 62.3× |
| Aixtron | 30.4× | 8.7× | 74.5× |
| Camtek | 32.8× | 13.3× | 151.3× |
| Tokyo Electron | 50.9× | 13.0× | 52.2× |
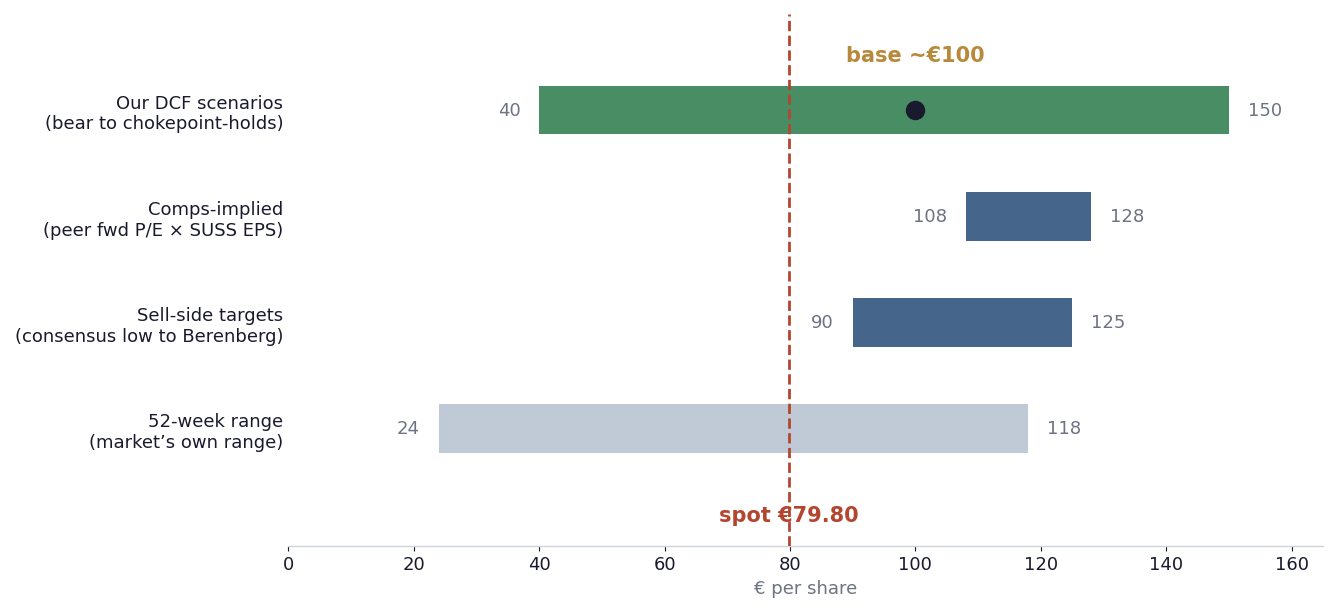
The trailing-P/E column shows the trough trap: a 41 to 151 times spread across the set means none of these businesses trades near normalised earnings, and it says nothing about whether SUSS is cheap or its peers dear. Forward P/E is the less-distorted read, and even there SUSS sits below every direct peer. Berenberg’s own analyst, Amelie Dueckelmann-Dublany, raised her target to €125 on 19 June 2026, the day SUSS closed at its 52-week high of €111.70, arguing that market participants have not yet priced the ongoing momentum. The most bullish sell-side read on the name was published at the top, and it still sits inside our chokepoint-holds ceiling.
Multiples from yfinance at the 23 Jul 2026 close. Forward P/E moves with consensus estimates, which SUSS’s FY2026 guidance has already cut once.
11 Three scenarios, three different drivers
−50 percent, 30 percent weight. SK Hynix’s flow skips passes and EV Group’s laser wins 16-hi volume; SUSS’s share caps and the 2025 to 2026 margin trough was correct pricing.
+25 percent, 45 percent weight. Management reaches about €825 million of 2030 sales, the middle of its guided range, on a roughly sixteen-times exit; SUSS keeps its number-two seat and the margin recovers to the guided floor. The house centre.
+88 percent, 25 percent weight. Layer count compounds, dual-sourcing opens SK Hynix, and SUSS gains at TEL-dominated accounts; the upper half of the guided range at a peak exit. Berenberg’s €125 sits inside this.
Probability-weight the three and the fair value is €95, about 19 percent above spot, with the base case near €100. The distribution is two-sided: the bull pays 88 percent and the bear costs 50, so we watch and size a starter. The single driver is the share SUSS captures as layer count climbs.
12 Up 365, then down 29
The 52-week range runs €23.99 to €118.40, and the order of those prints matters more than the spread. SUSS bottomed at a €24.03 close on 2 September 2025, then rallied to €111.70 on 19 June 2026, a 365 percent move, and has given back 29 percent since. At €79.80 the stock is up 104 percent for 2026 and sits nearer the top of its own 52-week band than the bottom.
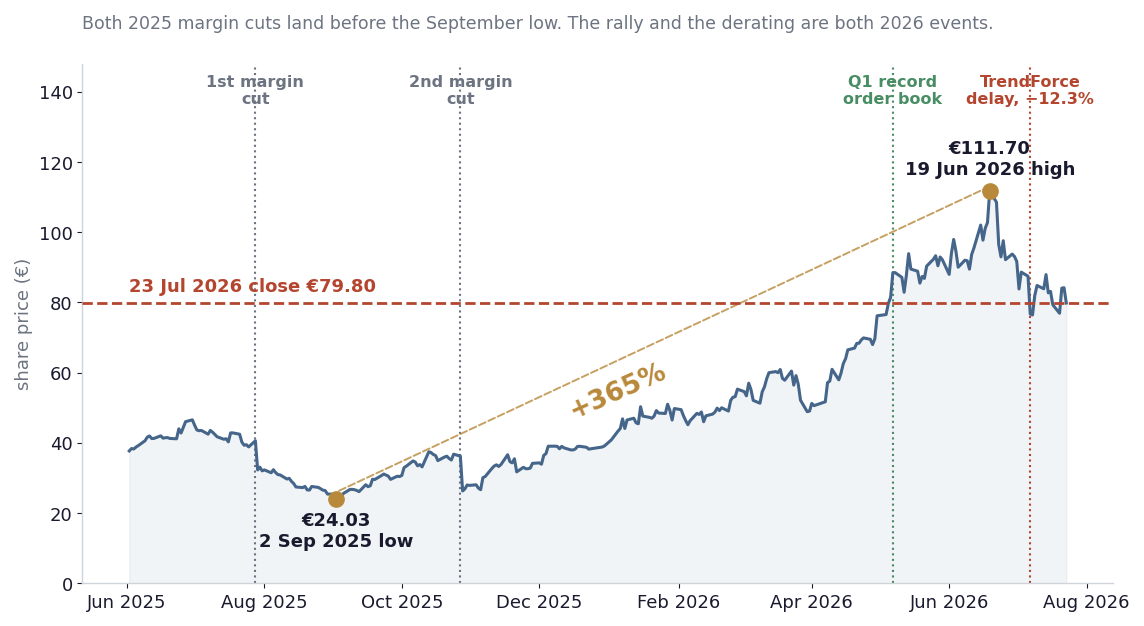
That ordering rules out the easy explanation. Both 2025 margin cuts landed before the September low, so they sit eight months and a 365 percent rally behind the current derating; they cannot be its cause. The fall from June’s high is a 2026 event, and its largest single day carries a date and a headline. Spot still sits below the comps-implied band and the sell-side range, with only our own bear leg beneath it, but a €40 bear case is a round trip to February 2026 rather than a catastrophe. A starter is sized for that, and the entry price is the weakest leg of this case.
13 The call
- A chokepoint grounded in physics: thinning is forced by the height budget, so no joining technology removes it.
- Volume compounds with layer count: stacks per accelerator are fixed, so a taller stack means more core dies and more passes.
- A corroborated number-two seat, about 55 percent of Samsung and Micron’s combined temp-bond spend, plus a fresh R&D toehold at SK Hynix.
- A record Q1 2026 order book, intake up 69.5 percent, order book up 23.7 percent, with Q1 the last quarter of the Zhubei double-rent drag.
- Priced at the bottom of the 2030 plan: the mid-case exit needs less revenue than management’s own floor; Berenberg targets €125.
- The margin is still at a 4.3 percent trough, less than half the guided floor, and 2025 brought two guidance cuts.
- The incumbent is ahead on both 2024-vintage broker reads of the step, and holds the SK Hynix line growing fastest.
- EV Group’s laser-debond platform is a credible wildcard at 16-hi HBM4, unproven at volume but purpose-built.
- The kill chain is unresolved in public sourcing: whether MR-MUF needs fewer passes than TC-NCF, and whether EVG’s laser beats SUSS’s dual capability at 16-hi.
- The SK Hynix seat is a toehold, not volume orders in Frick’s own words, and could stay one.
- The shares have doubled in 2026, and on 7 July they fell 12.3 percent on the hybrid-bonding delay we read as a reprieve.
SUSS sells a step that every added HBM layer runs again, at a price that buys the bottom of its own management’s plan and nothing above it, after tripling off last September’s low. The call stays at watch with an accumulate tilt: a starter position, not a full one, until the H1 2026 report shows the margin closing and not only the order book improving. SK Hynix’s process choice, more than its supplier relationship with Tokyo Electron, decides whether the share caps, and until that prints, sizing past a starter prices a physics argument as a fact.
14 Scorecard
15 What moves the call
▲ Toward accumulate
- H1 2026 EBIT margin printing above 6 percent, halfway back to the guided floor.
- A second consecutive quarter of order intake running above revenue.
- A pullback toward the mid-€50s to €65, near the trough case, where the entry no longer needs the bull.
▼ Toward reduce
- A third guidance cut.
- Public evidence that Tokyo Electron or EV Group has won a qualified design slot at Samsung or Micron specifically.
- A melt-up toward the €130 to €150 chokepoint-holds ceiling, where we would trim.
16 How we would express it
1. Starter long SUSS, add on confirmation. Buy a starter near €80, sized well below a full position, and add toward the mid-€50s to €65 or on a second quarter of intake above revenue. The entry pays for the physics without needing the bull, and without pretending it is cheap after a triple off the low.
Risk: the margin trough proves structural, and the H1 report shows the order book improving with no margin following.
2. Pair trade: long SUSS, short an expensive comp. SUSS trades at about 21 times forward earnings against 30 to 36 times for Besi, ASMPT, Aixtron and Camtek. A small, beta-aware long-SUSS, short-Besi pair expresses the cheapest seat in the set without a view on memory’s direction.
Risk: the comps are not a clean hedge, since their end-market mix differs from SUSS’s HBM concentration, and a sector de-rate moves both legs together.
Treat a Tokyo Electron or EV Group design-slot win at Samsung or Micron as the signal to cut, not to average down: the cleanest evidence that the share is capping.
17 Dates to watch
The events that resolve the call over the coming months:
- Early-to-mid August 2026: H1/Q2 2026 report. The first hard read on whether Q1’s 4.3 percent EBIT margin was a fixed-cost trough or the FY2026 run rate.
- H2 2026: HBM4 16-hi process disclosures at SK Hynix, Samsung and Micron. Which final-joining technology each maker ships, the direct test of the kill chain.
- Ongoing: SUSS book-to-bill. Whether Q1 2026’s record order intake converts into revenue or piles up as backlog.
Two predictions we will mark, dated. First, SUSS’s reported H1 2026 EBIT margin prints above 6 percent, a narrowing from Q1’s 4.3 percent toward the guided floor, resolved against the H1 report by mid-August 2026. Second, SK Hynix converts its R&D-line toehold into a repeat or volume order by 31 December 2026, resolved against company disclosures and trade press. We expect the first and not the second; the second landing early would take conviction above Medium.
Not investment advice. For information and discussion only, and not a personal recommendation, offer or solicitation. Capital is at risk, and investments can fall as well as rise. The scenario fair values and price levels here are the publisher’s own estimates, not a forecast or a guarantee. Do your own work.
All figures come from SUSS MicroTec’s public disclosures, public market and industry data, and the publisher’s own calculations. Sell-side and industry analyst material is attributed by name and date wherever it informs the discussion above; it does not back any published figure or price level beyond what is explicitly sourced to it. © 2026 chokepoints.ai · Issue 007 · SUSS sells the step that makes each HBM layer thin enough to fit inside the stack’s own height limit, and it sells the second-most of it. All issues